Description:
The two types of vorticity advection are positive (PVA) and negative vorticity
advection (NVA). 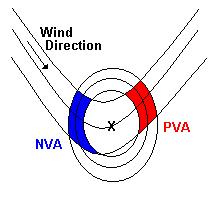 The closed circles in the figure show the 500 hPa absolute vorticity
lines, the others the 500 hPa height lines. When an air parcel is moving from
an area higher vorticity to an area lower vorticity this is called: PVA
(red color). The other way around is called: NVA (blue color). PVA is
associated with upper-air divergence, i.e. upward vertical motion. NVA
is associated with down ward vertical motion. Therefore, PVA at 500
hPa is strongest above a surface low, while NVA at 500 hPa is strongest
above a surface high.
The closed circles in the figure show the 500 hPa absolute vorticity
lines, the others the 500 hPa height lines. When an air parcel is moving from
an area higher vorticity to an area lower vorticity this is called: PVA
(red color). The other way around is called: NVA (blue color). PVA is
associated with upper-air divergence, i.e. upward vertical motion. NVA
is associated with down ward vertical motion. Therefore, PVA at 500
hPa is strongest above a surface low, while NVA at 500 hPa is strongest
above a surface high.
In operational meteorology Vorticity advection maps are used to identify areas with vertical air motion to see where clouds, precipitation or clear conditions are likely to occur. Keep in mind, however, that PVA is not the same as upward vertical motion. Here temperature advection is important too.
 The closed circles in the figure show the 500 hPa absolute vorticity
lines, the others the 500 hPa height lines. When an air parcel is moving from
an area higher vorticity to an area lower vorticity this is called: PVA
(red color). The other way around is called: NVA (blue color). PVA is
associated with upper-air divergence, i.e. upward vertical motion. NVA
is associated with down ward vertical motion. Therefore, PVA at 500
hPa is strongest above a surface low, while NVA at 500 hPa is strongest
above a surface high.
The closed circles in the figure show the 500 hPa absolute vorticity
lines, the others the 500 hPa height lines. When an air parcel is moving from
an area higher vorticity to an area lower vorticity this is called: PVA
(red color). The other way around is called: NVA (blue color). PVA is
associated with upper-air divergence, i.e. upward vertical motion. NVA
is associated with down ward vertical motion. Therefore, PVA at 500
hPa is strongest above a surface low, while NVA at 500 hPa is strongest
above a surface high. In operational meteorology Vorticity advection maps are used to identify areas with vertical air motion to see where clouds, precipitation or clear conditions are likely to occur. Keep in mind, however, that PVA is not the same as upward vertical motion. Here temperature advection is important too.